Launched
Student Intervention Reports for Mathverse by Quizizz —
Lead Product Designer
Helping teachers act at the right moment through actionable reports (2023 - 2024)
*Updated product name - The product is now known as VoyageMath
Project Overview
In true startup fashion, this project was born out of both a business opportunity and a genuine need. Quizizz was looking to expand its product offering (to drive revenue growth), and math, of all subjects, became a clear focus as research showed that students in the U.S. were falling behind in math at an alarming rate, a trend accelerated by the pandemic. At the same time, demand for math-focused learning tools especially those offering rich data and insights for teachers had spiked, especially in middle school (grade 6 and above). The existing Quizizz platform lacked the depth and sophistication that competitors were offering, particularly when it came to helping teachers identify and support struggling students. This was our moment to step up and build something that made math a little less scary for students, and a lot more actionable for teachers.
Team
Swati Banerjee - Product Designer
Aditi Soni - Product Manager
Harshini B - User Researcher
Shashwat Tyagi - Front-End Developer
Gayathri N - Graphic Designer
Aarya Sohal - Graphic Designer
Role
UI/UX Design, Research, Interaction Design, and System Design.
Target Users
6th grade Math teachers across North America.
Project Challenges
Differentiate from Quizizz’s existing product: While Quizizz had long been a favourite for classroom engagement, it lacked the depth needed for effective math instruction, especially when it came to data. We set out to shift how teachers perceived Quizizz: from a lighthearted, game-based tool to a serious, comprehensive platform that supports real learning.
Move beyond the “create your own quiz” model: Teachers needed a faster way to assign high-quality content. We aimed to shift from user-generated quizzes to expert-vetted, standards-aligned skill sets that could be quickly assigned and taught, something Quizizz was not known for. However, the challenge was also producing high-quality, vetted content quickly enough to test the MVP with teachers and using those learnings to scale effectively.
Move beyond assessment to enable intervention: Traditional Quizizz reports showed performance only after the fact. We needed to reimagine reporting as a real-time support system — This would become our USP!
Decision Moments!
Create a dedicated experience outside Quizizz’s core platform: To give the product a real chance at success, we needed to build a separate landing page and infrastructure branded “by Quizizz” but free from the clutter of the main platform. This was, after all, the only subject-specific product Quizizz had ever built. However, we continued to leverage core infrastructure from the main Quizizz platform such as class roster management to ensure seamless data flow across both experiences.
Build a structured, standards-aligned math content library: Teachers needed a reliable way to find and assign relevant math skills. Our in house subject experts created a curated bank of vetted content organised by U.S. education standards to make search, selection, and assignment effortless.
The team chose to start with Grade 6 Algebra, a high-stakes topic that’s both a common challenge for students and a key focus for teachers. We also aligned the launch with the academic calendar to ensure relevance and timely adoption.
Redesign reports from the ground up: Traditional Quizizz reports weren’t built for instruction, they were built for review. We needed to create a completely new reporting experience.
A well-rounded reporting tool that supports real-time gap identification, post-class instructional planning, and serves as an effective grading aid for teachers.
Prove the concept through real-world validation: To ensure we were solving the right problem, we started by designing and launching the reports first, then tested them with Quizizz’s in-house community of teachers to validate both utility and usability.
Project Highlights
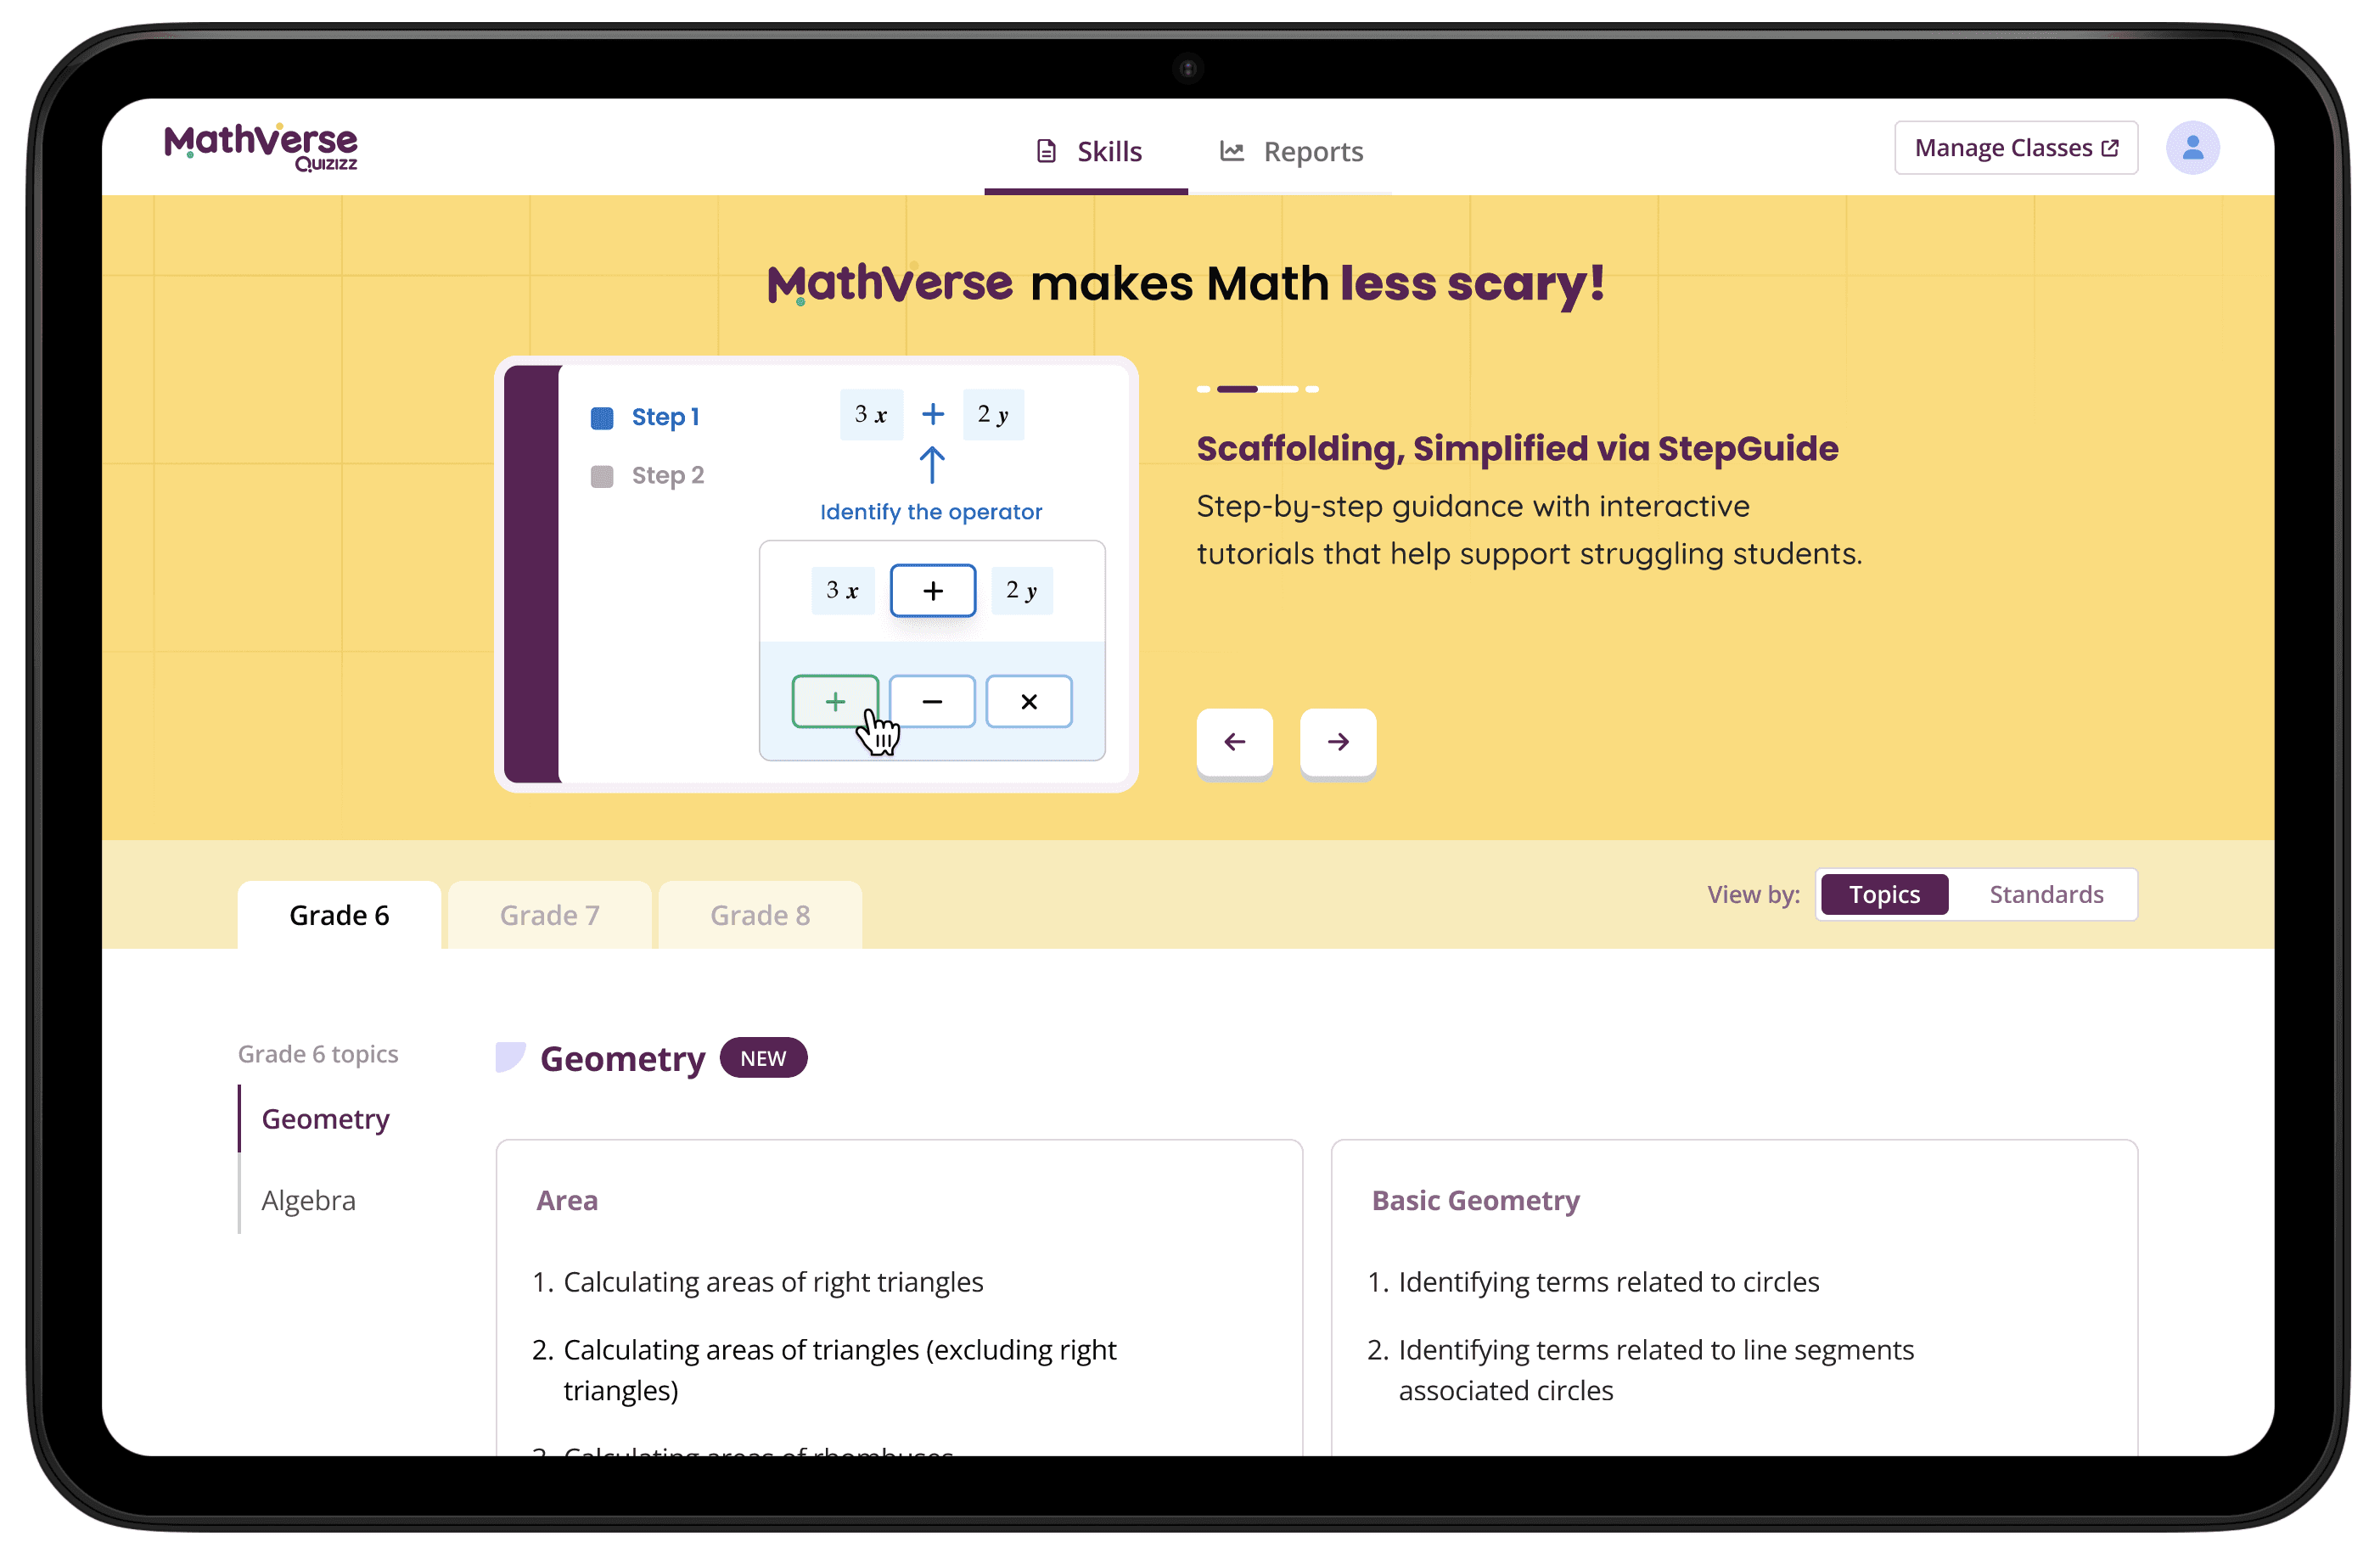
A no-fuss landing page organised by grades, topics and standards, allowing teachers to quickly browse and select the exact skills they want to teach for a given class.
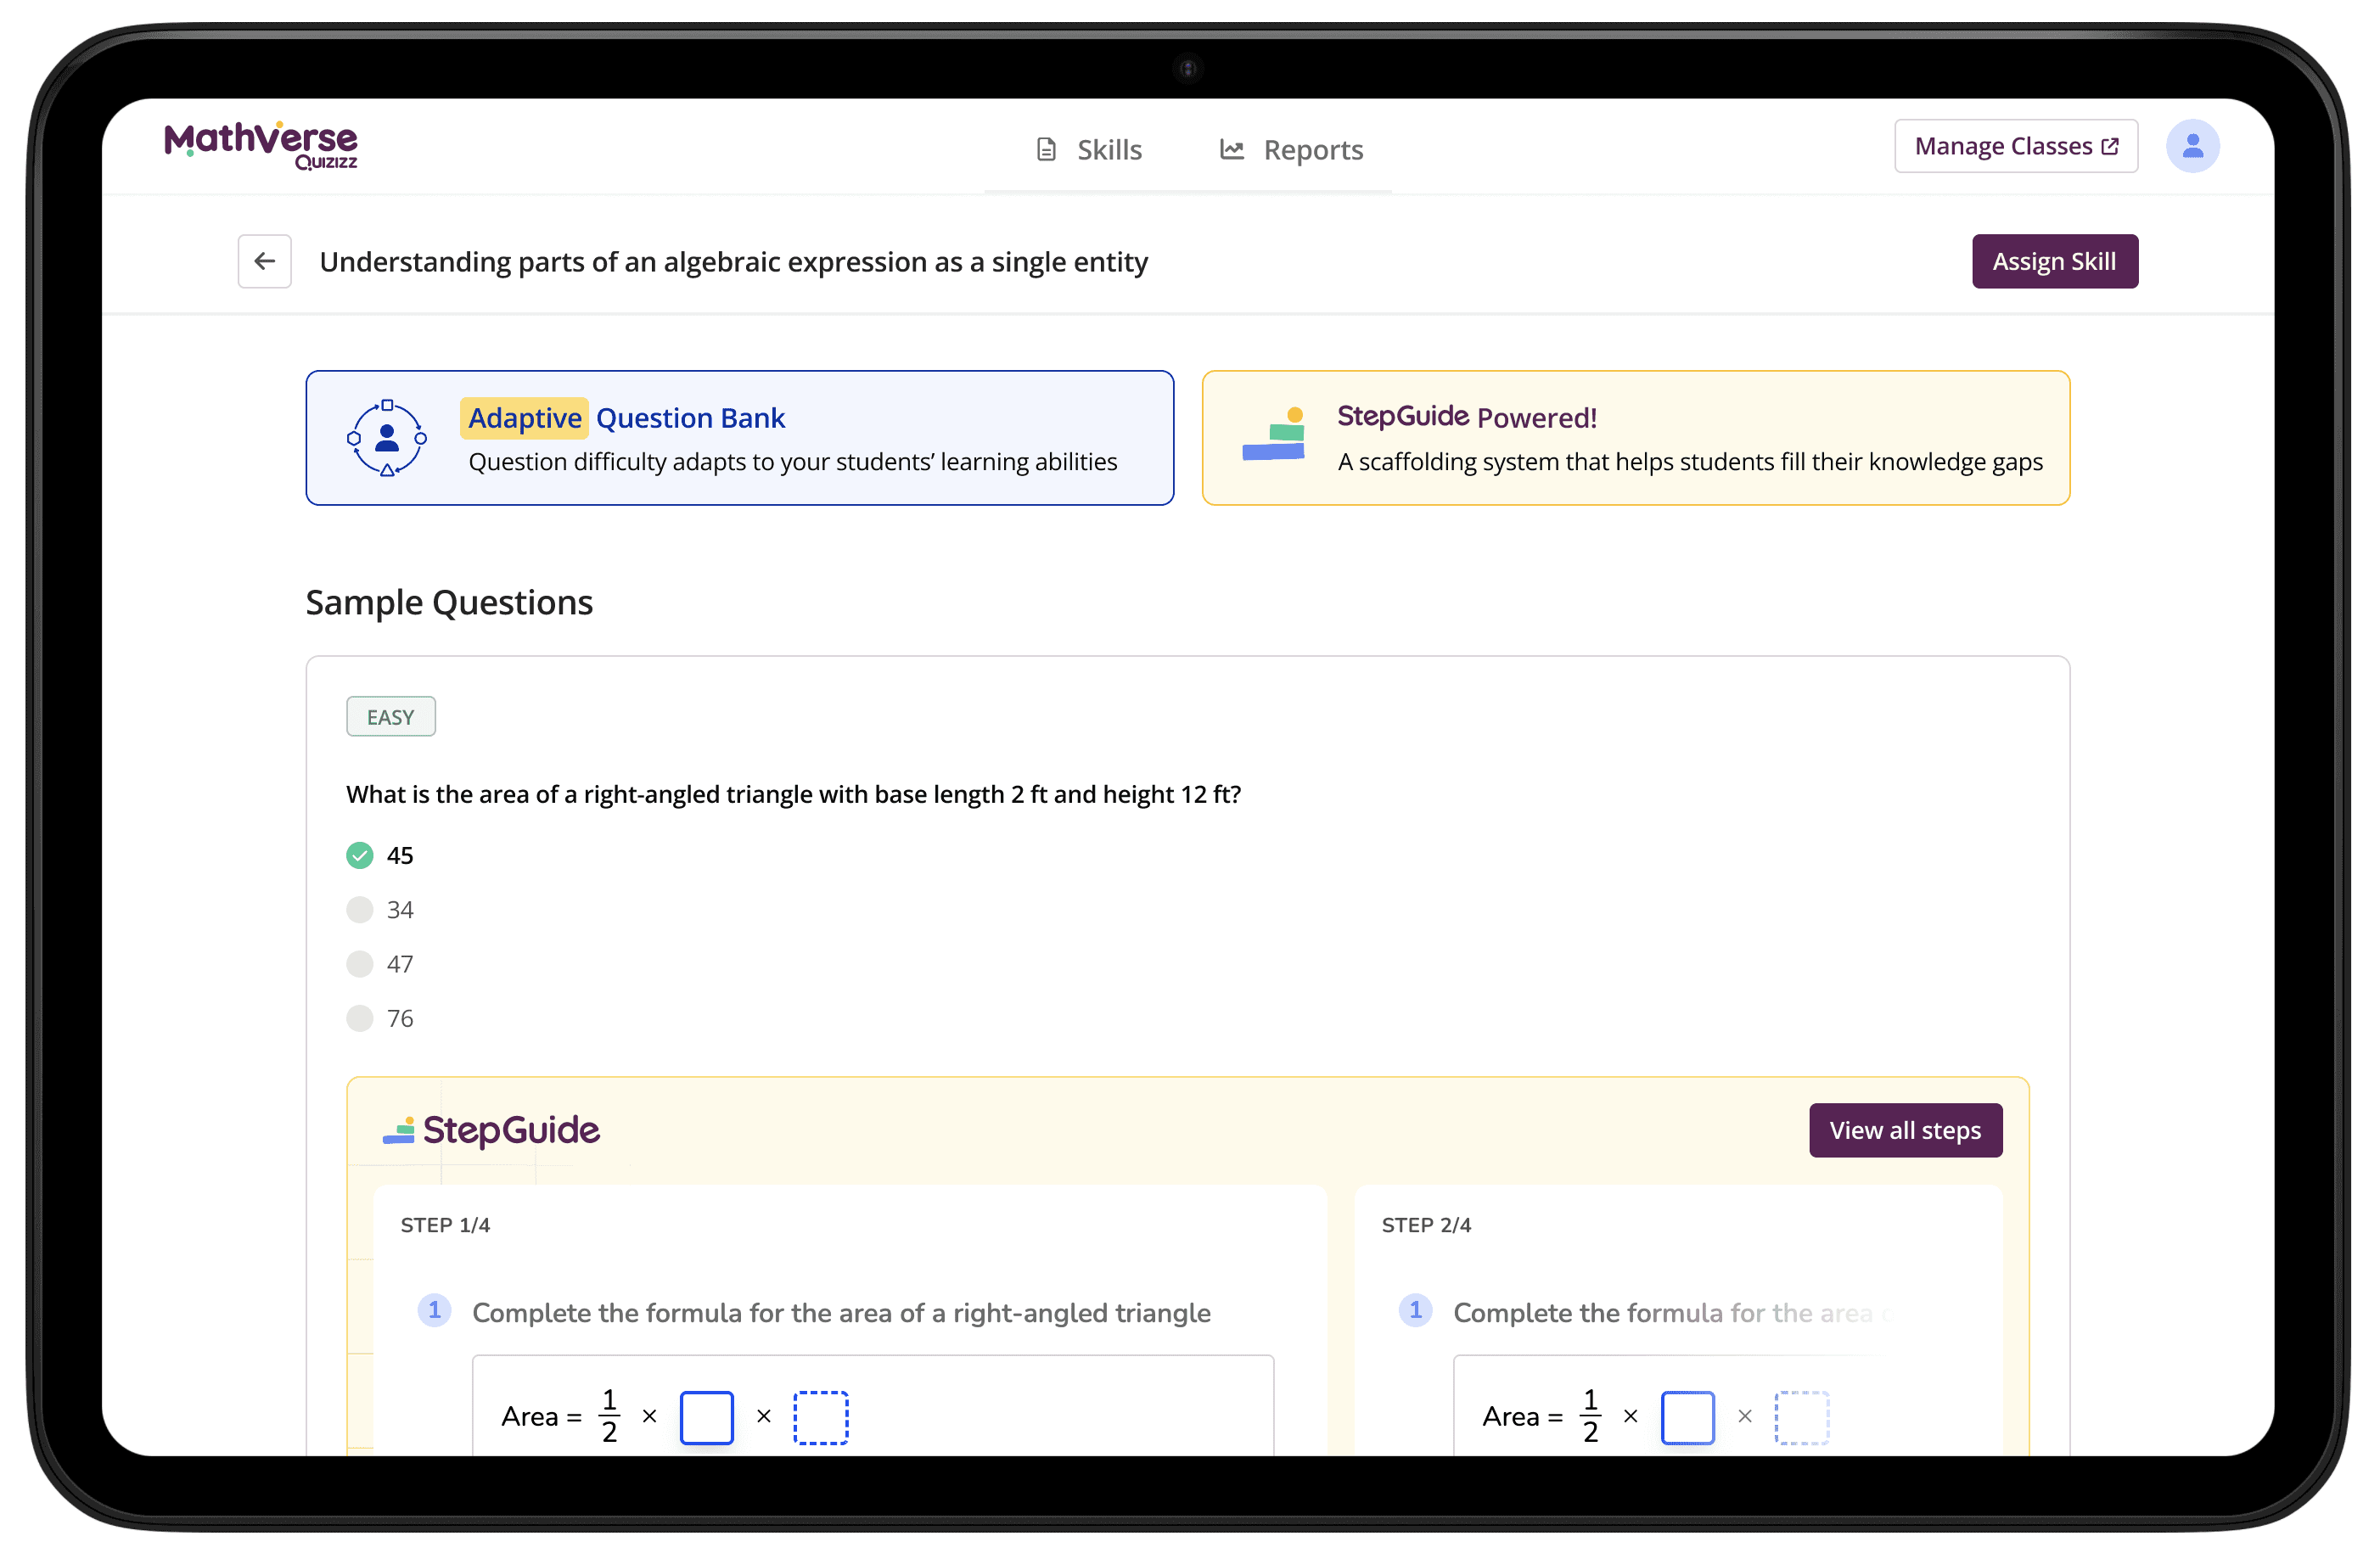
A detailed skill view that includes a preview of the question bank, along with StepGuide — the scaffolding system that helps students break down and solve questions step by step on their end.
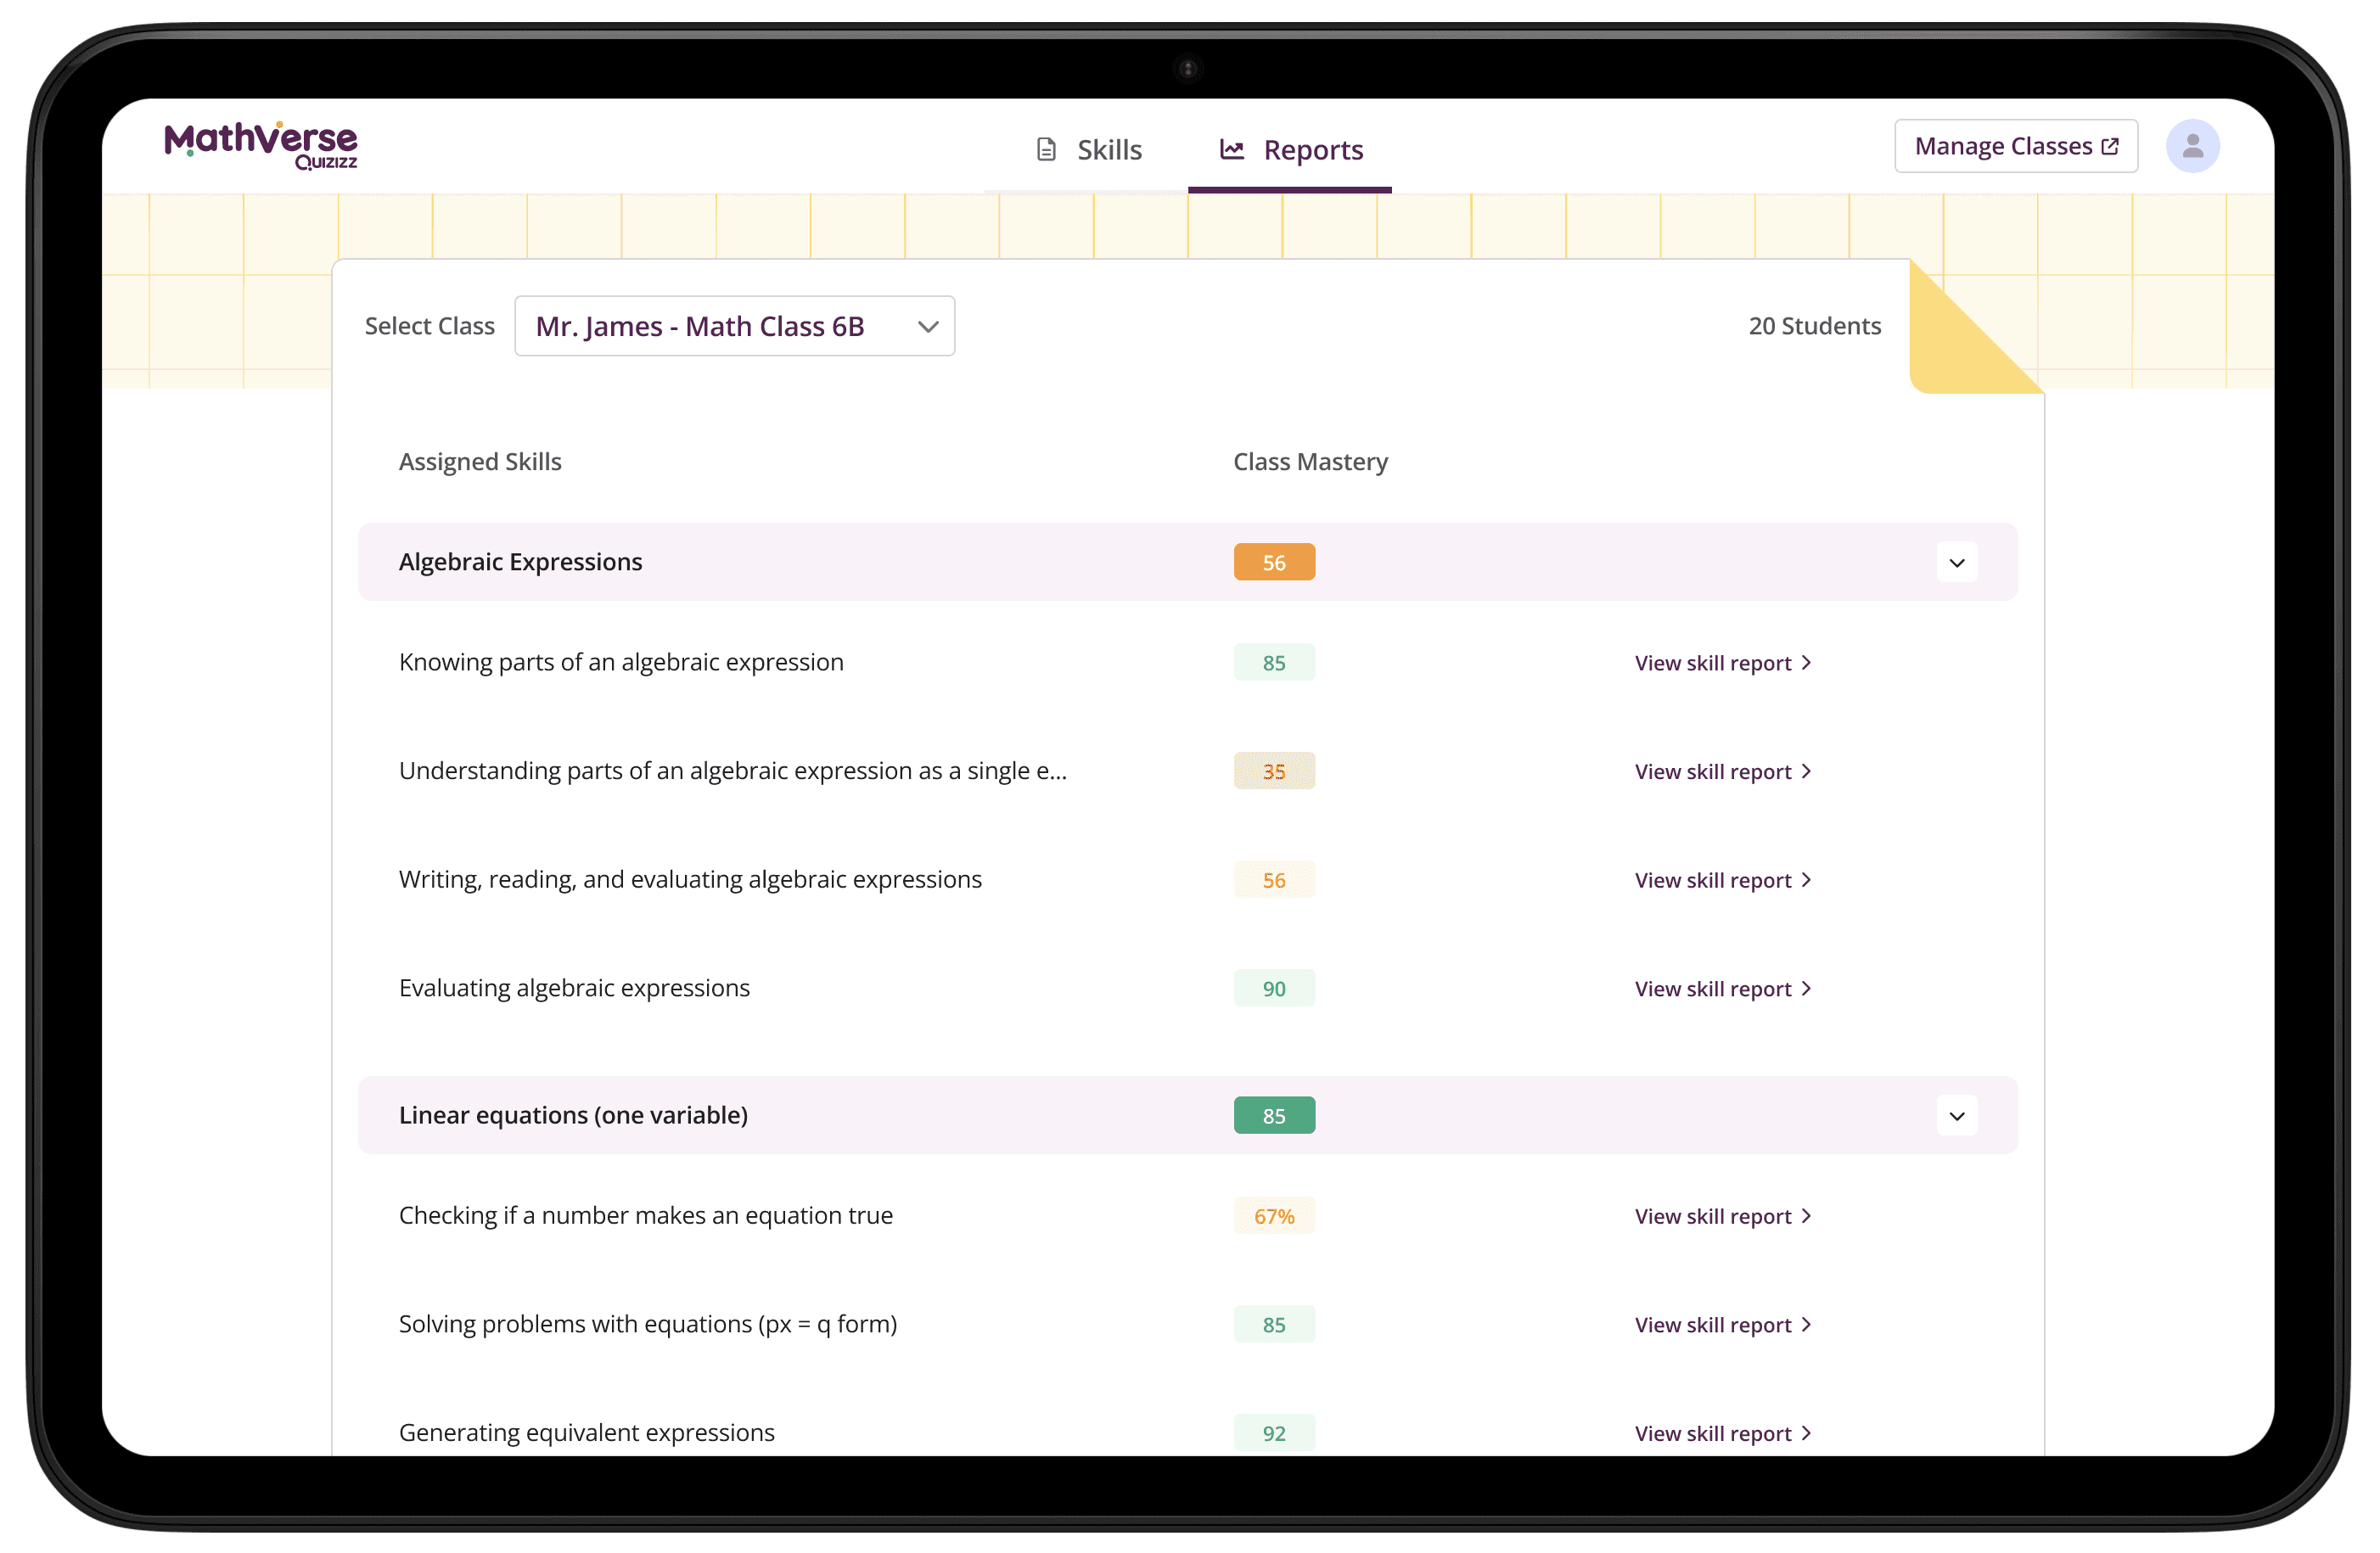
The reports tab organised by various classes created by the teachers and assigned skills under them. It provides a clear overview of class-wide skill mastery, helping teachers quickly decide whether a skill needs to be revisited for the whole class.
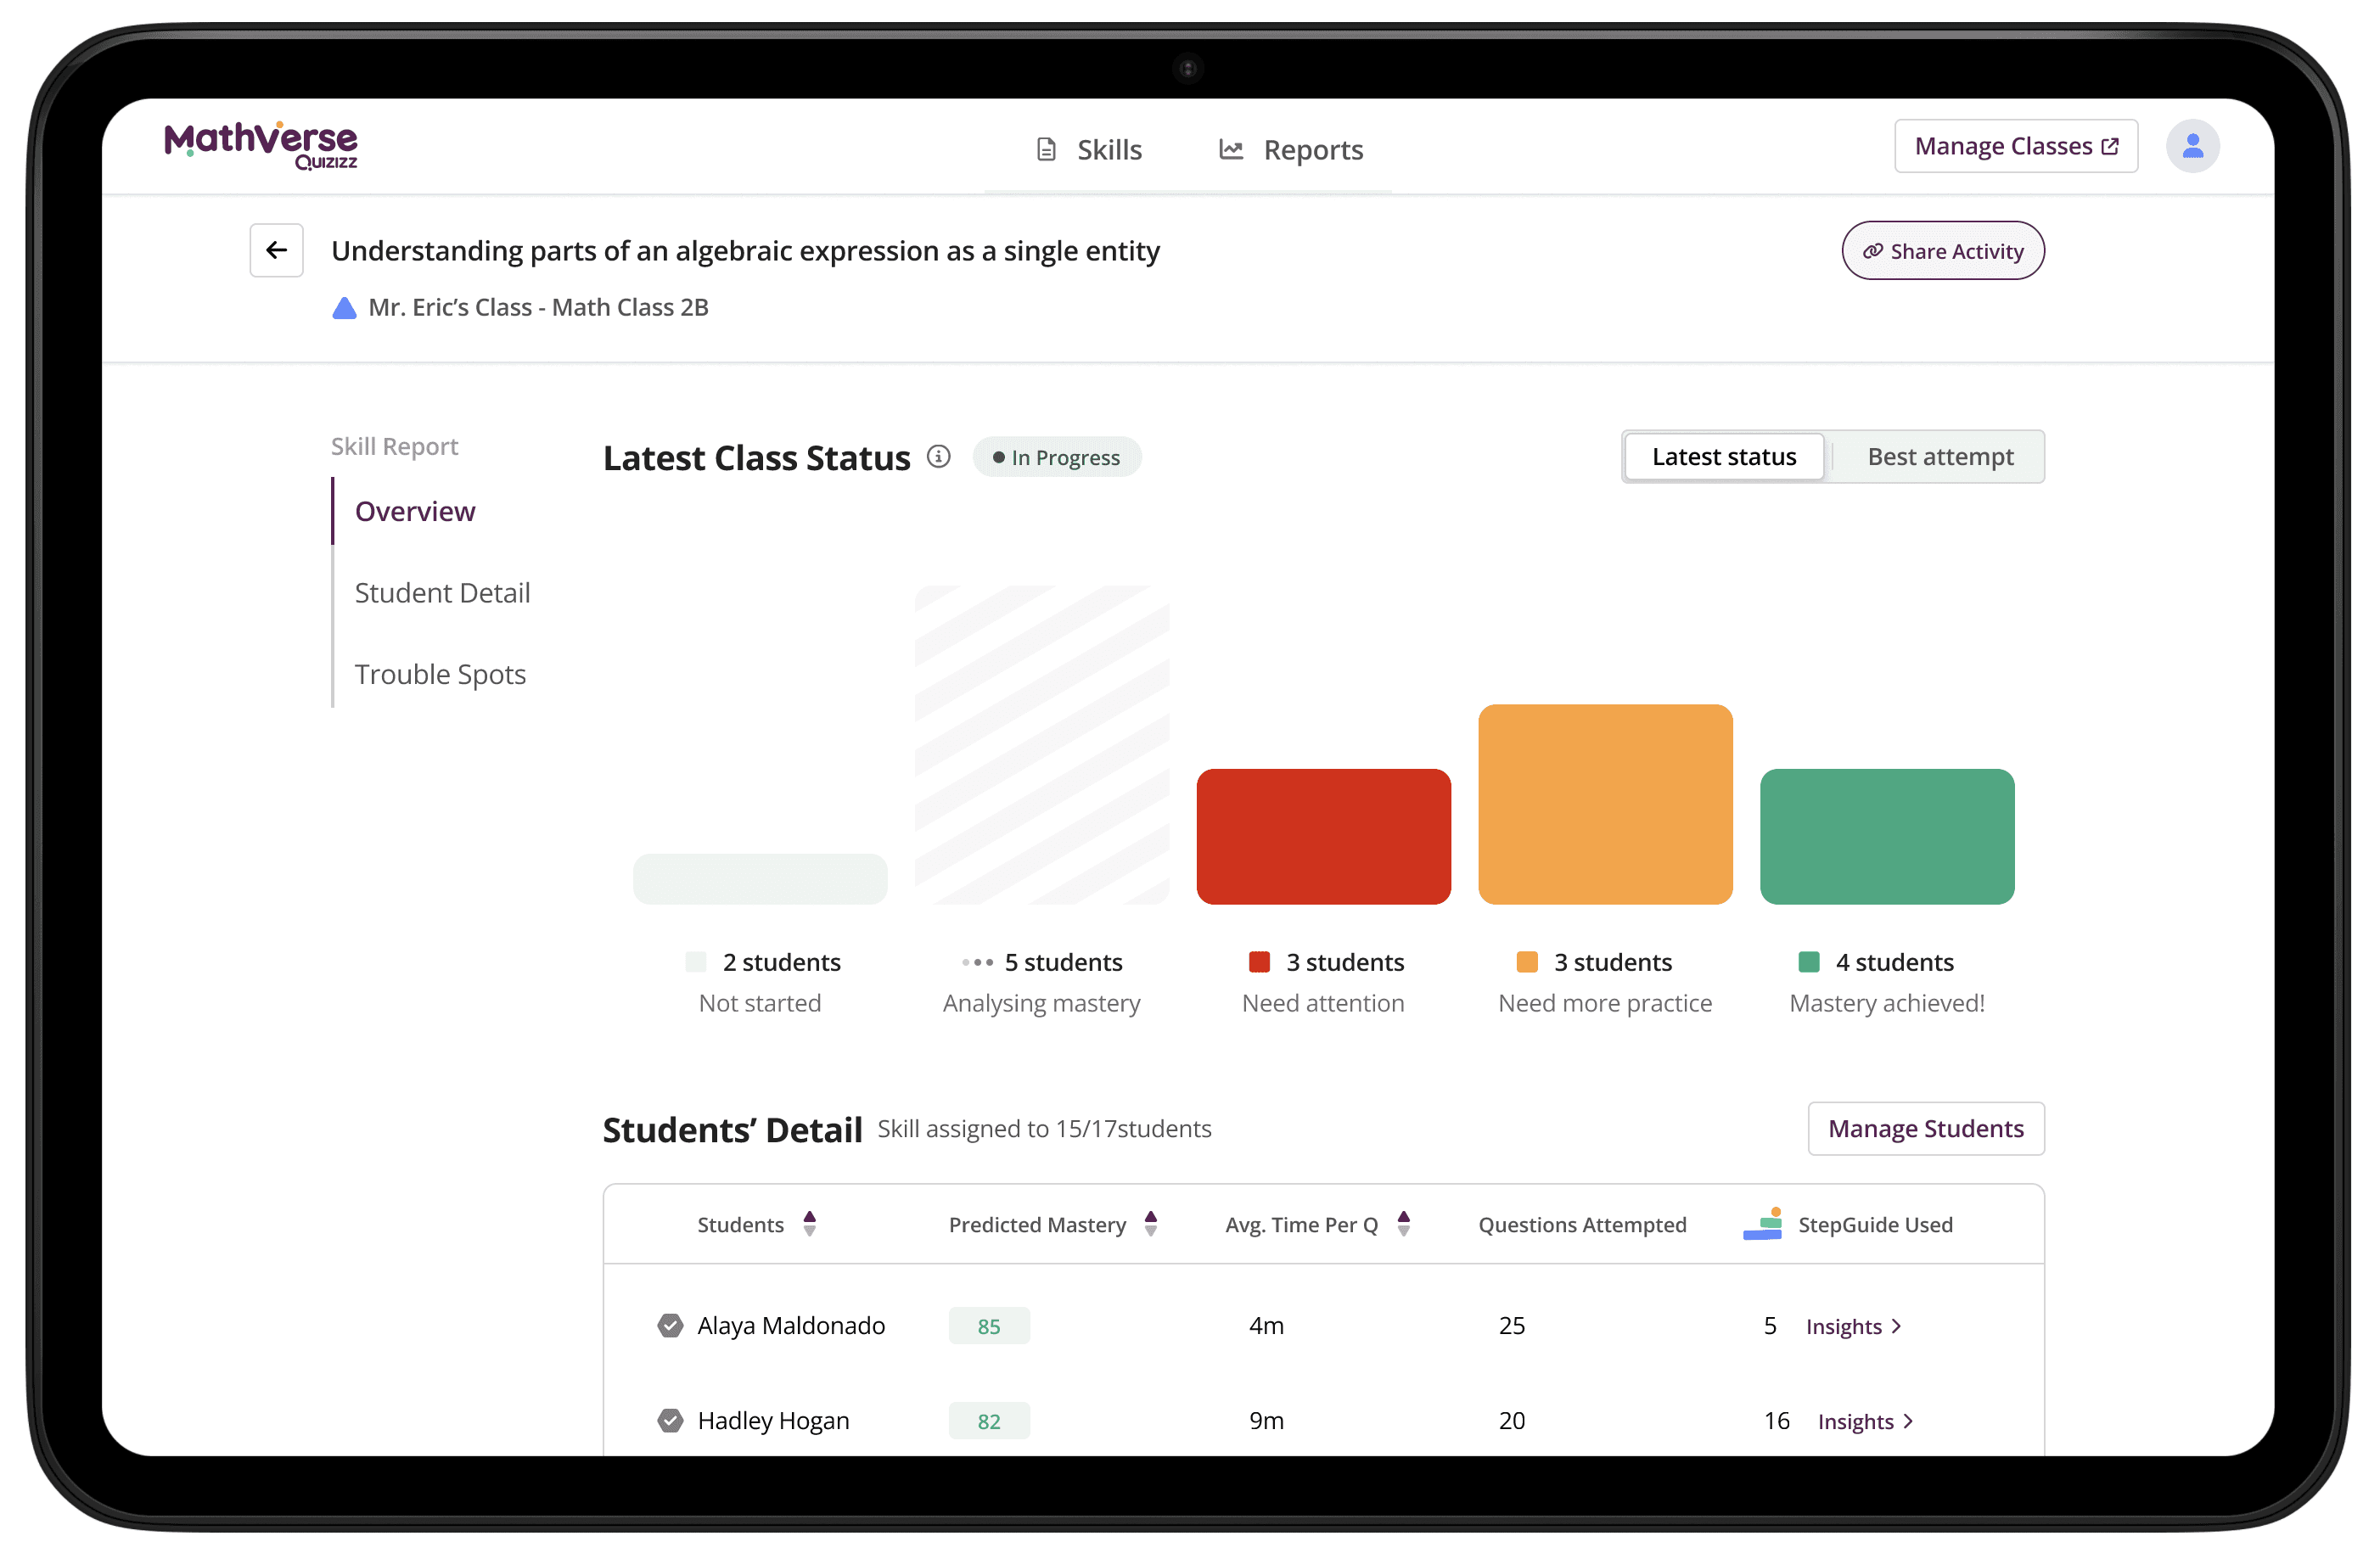
The Skill Report displays real-time data, giving teachers a snapshot of overall class performance, individual student progress, and common class trouble spots.
Challenges with Building Reports
Surface real-time student data: Give teachers live visibility into how students are performing as the activity unfolds, enabling timely and targeted intervention when it matters most.
Information overload vs. usefulness: Teachers are short on time and attention. If reports were too complex, they'd be ignored. If too simple, they wouldn't add value. We had to strike a balance between depth and clarity. Especially going up against its direct competitor — IXL!
Prioritisation in a noisy classroom: With 20+ students working simultaneously, it wasn’t enough to just show data, we had to surface what's urgent so teachers knew exactly who to help and why.
Making math-step-specific insights clear: It wasn’t enough to show scores, we had to highlight skill gaps, or error patterns specific to math step, which made the report logic more complex than generic quiz feedback.
Highlight student effort, not just the final score: Show the effort students put in while attempting the activity.
Process
Kicking off the project – a collaborative discovery phase across product, research, and design:
Competitive analysis: The PM and I led a thorough audit of other edtech platforms to understand how they handle real-time data and teacher-facing reports, while aligning our direction with broader business goals.
Teacher interviews: Our researcher spoke to multiple teachers to explore how classrooms are run, how instruction time is structured, and what support is truly valuable during live math sessions. I observed these calls and assisted the researcher by providing questions.
Foundational product scoping: I defined a high-level product architecture and mapped out the core feature set needed to support the MVP.
Co-design with teachers: I worked closely with educators to understand their mental models, surface pain points, and determine what they needed and didn’t need in a real-time reporting tool. I quickly iterated on several concepts using FigJam, testing and validating each version with teachers and refine the experience based on real classroom needs.
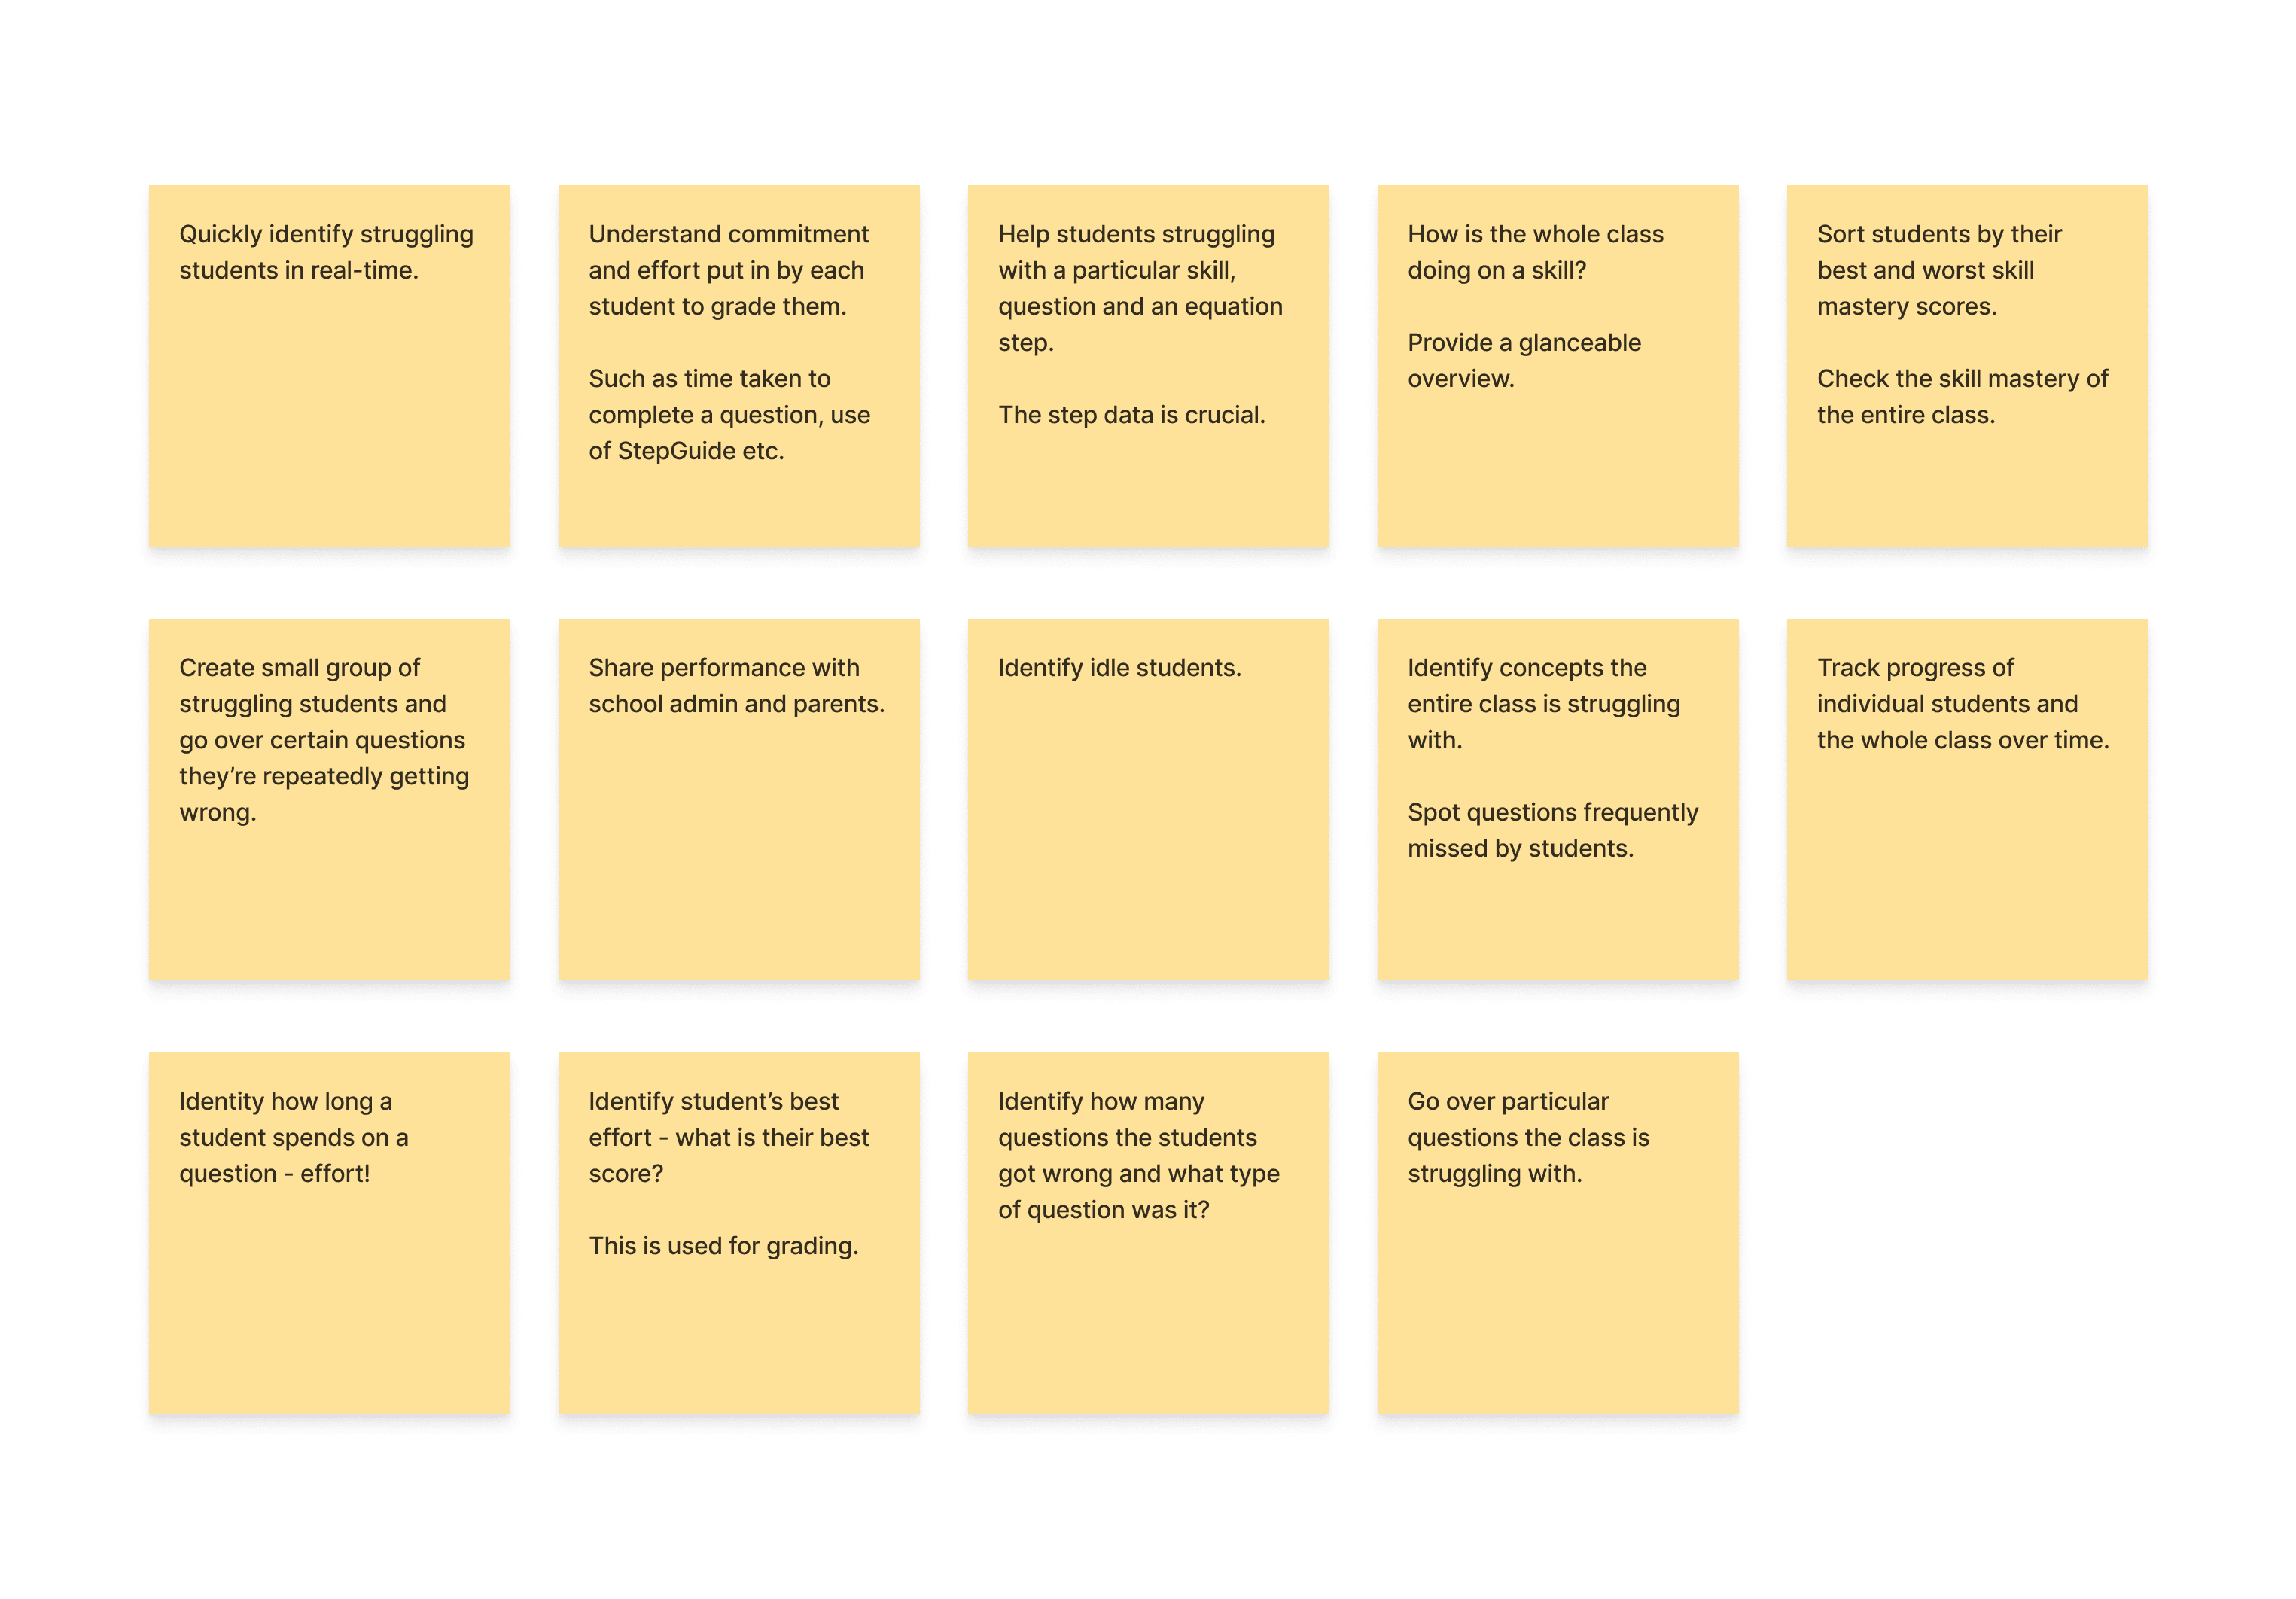
Key Insights from Research that Informed the First Version of Reports
Class Skill Report
Real-time class overview: Teachers could see how the entire class was performing during the activity, not just after it ended.
Individual student progress: Each student's progress was visible, helping teachers identify who was excelling and who needed support.
Highlighting common struggle areas: The report surfaced concepts and questions that multiple students were getting wrong, making class-wide misconceptions easy to spot.
Actionable insights for timely intervention: By combining real-time data with clear visual cues, the Skill Report enabled teachers to intervene during the learning process, not after the fact.
Detailed Student Skill Report
Error patterns at a glance: Teachers could see specific steps in an equation where the student consistently went wrong.
Performance summary: Showed the number of incorrect questions to help teachers quickly assess mastery.
Effort indicators: Displayed metrics like average time spent per question and the number of times the scaffolding system was used, giving teachers a sense of student persistence.
Difficulty-level breakdown: Organised attempted questions by difficulty (easy, medium, hard) for a more nuanced understanding of skill level.
Quick student switch: Included a dropdown for easily navigating between students, enabling a smooth, frictionless review experience during or after class.
Learning & Reflection
Effort is a powerful metric
One of our most appreciated features was highlighting student effort, not just performance. This insight reshaped how we framed success, and how teachers approached support and praise in their classrooms.Glanceable data was highly valued
Teachers appreciated quick, at-a-glance charts and tables. The class progress overview and individual student performance table stood out as particularly useful during live sessions.Class trouble spots were underused during class
This section didn’t see as much engagement in real time. Through follow-ups, we learned that teachers used it more as a post-class recap tool to plan future lessons, highlighting a gap in in-the-moment class-level insights.Focus was on students missing “easy” questions
Teachers rarely explored the medium or hard question tabs within the trouble spots section. Most attention was given when students struggled with “easy” questions, seen as red flags. However, the StepGuide data in this section helped teachers tailor their next lessons more effectively.
A clear improvement over the legacy experience
In user interviews, teachers consistently preferred the new reports over the original Quizizz reports. Their feedback confirmed we were moving in the right direction by offering more actionable, thoughtful data.